
Information Design
Designing insight-driven infographics for Proactive For Her, transforming sensitive women's health research into clear, approachable visual reports.
Overview
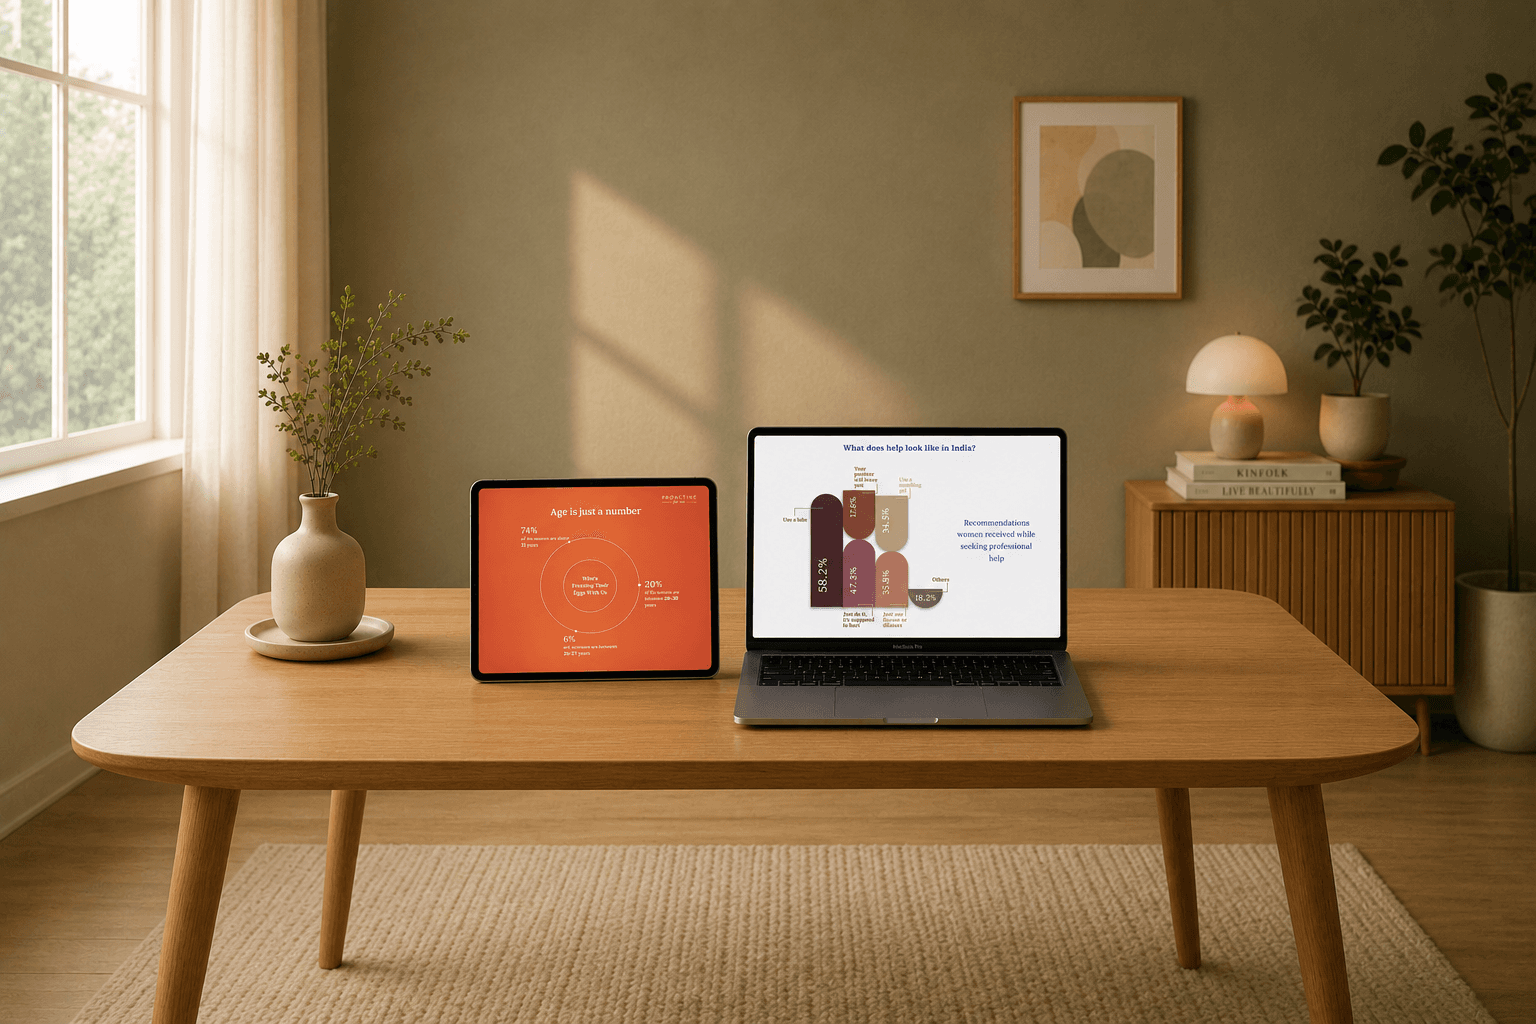
Each report distills hundreds of survey responses and personal stories into a clear visual narrative, using data visualization, iconography, and photography to make deeply personal health topics easier to understand and talk about.
Reports
Vaginismus Report
Survey insights from 750+ women, exploring an under-discussed and under-diagnosed condition.
Egg Freezing Report
A data-led look at why, when, and how Indian women are choosing to freeze their eggs.
Research findings transformed into accessible reports through clear content structure, intuitive information hierarchy, and custom visualizations that simplify complex healthcare topics.
Design system
Large insight Cards, radial and funnel charts, and real photography recur across both reports, keeping dense research approachable rather than overwhelming.
Presenting sensitive health data required precision without losing warmth, so the numbers could inform without ever feeling cold or clinical.